Figure 2-17
The Toolbox (see Figure 2-18) contains all the controls that you can use in your applications. You can drag controls from the Toolbox and drop them onto the design surface of your application.
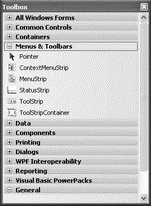
Figure 2-18
Each tab in the Toolbox contains controls that are related to a specific purpose. You can create your own tab to house your own controls. To do so, right-click on the Toolbox and select Add Tab. Name the newly created tab (see Figure 2-19).
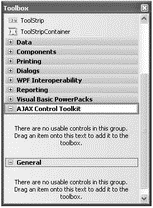
Figure 2-19
To add controls to the Toolbox, right-click on the tab to which you want the controls added and select Choose Items. The Choose Toolbox Items dialog (see Figure 2-20) opens.
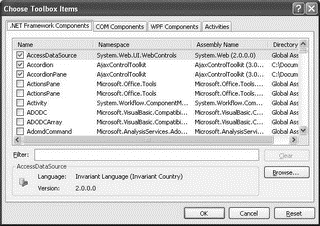
Figure 2-20
You can add the following types of controls to the Toolbox:
□ .NET Framework components
□ COM components
□ WPF components
□ Workflow activities
You can also click the Browse button to locate the .dll file that contains your own custom controls.
Another way to add controls to the Toolbox is to simply drag the DLL containing the controls and drop it directly onto the Toolbox.
You can relocate the Toolbox by dragging it and repositioning it on the various anchor points on the screen. Figure 2-21 shows the anchor points displayed by Visual Studio 2008 when you drag the Toolbox.
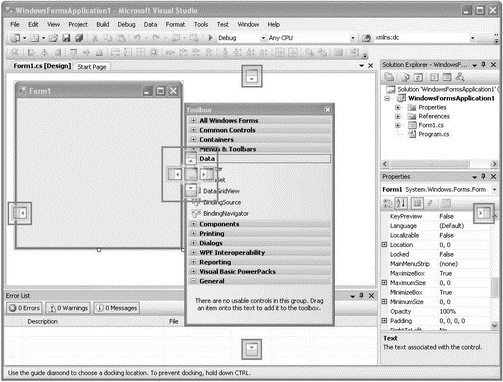
Figure 2-21
If you have limited screen real estate, you might want to auto-hide the Toolbox by clicking the Auto Hide button (see Figure 2-22).
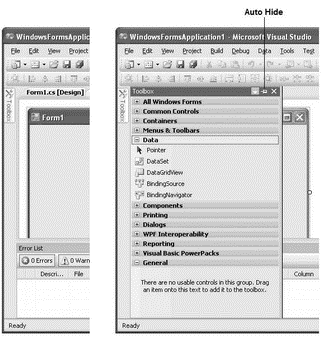
Figure 2-22
Sometimes, for some unknown reasons, the controls in the Toolbox may suddenly go missing. The usual remedy is to right-click the Toolbox and select Reset Toolbox. This works most of the time. However, if that fails to work, you may need to do the following:
Navigate to C:Documents and Settings<user_name>Local SettingsApplication Data MicrosoftVisualStudio9.0.
Within this folder are some hidden files. Simply delete the following files: toolbox.tbd, toolboxIndex.tbd, toolbox_reset.tbd, and toolboxIndex_reset.tbd.
Then restart Visual Studio 2008. Your controls should now come back up!
The Solution Explorer window contains all the files and resources used in your project. A solution contains one or more projects. Figure 2-23 shows the various buttons available in the Solution Explorer.
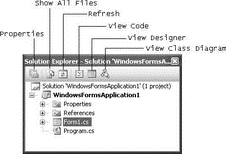
Figure 2-23
The buttons in the Solution Explorer window are context sensitive, which means that some buttons will not be visible when certain items are selected. For instance, if you select the project name, the View Code and View Designer buttons will not be shown.
To add additional items such as a Windows Form or a Class to your current project, right-click the project name in Solution Explorer, select Add (see Figure 2-24), and then choose the item you want to add from the list.
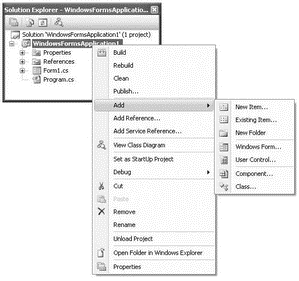
Figure 2-24
You can also add new (or existing) projects to the current solution. To do so, right-click on the solution name in Solution Explorer, select Add (see Figure 2-25), and then select what you want to add.
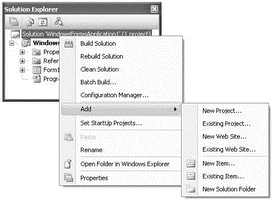
Figure 2-25
When you have multiple projects in a solution, one of the projects will be set as the startup project (the project name that is displayed in bold in Solution Explorer is the startup project). That is, when you press F5 to debug the application, the project set as the startup project will be debugged. To change the startup project, right-click the project that you want to set as the startup and select Set as Startup Project (see Figure 2-26).
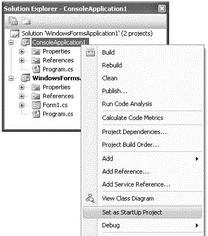
Figure 2-26
To debug multiple projects at the same time when you press the F5 key, set multiple projects as the startup projects. To do so, right-click on the solution name in Solution Explorer and select Properties.
Select the Multiple Startup Projects option (see Figure 2-27), and set the appropriate action for each project (None, Start, or Start Without Debugging).
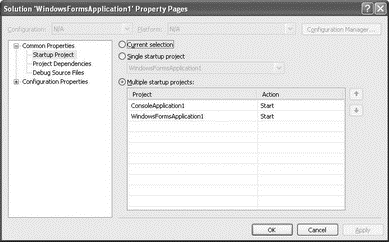
Figure 2-27
Then when you press F5, the projects configured to start launch at the same time.
The Properties window shows the list of properties associated with the various items in your projects (Windows Forms, controls, projects, solutions, etc).
Figure 2-28 shows the Properties window displaying the list of properties of a Windows Form (Form1, in this example). By default, the properties are displayed in Categorized view, but you can change it to Alphabetical view, which lists all the properties in alphabetical order.
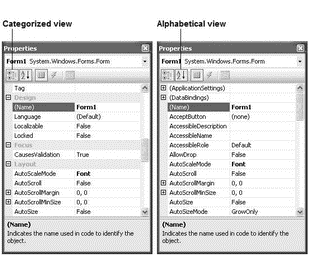
Figure 2-28
All default property values are displayed in normal font, while nondefault values are displayed in bold. This feature is very useful for debugging because it enables you to quickly trace the property values that you have changed.
Besides displaying properties of items, the Properties window also displays events. When the Properties window is displaying an item (such as a Windows Form or a control) that supports events, you can click the Events icon (see left side of Figure 2-29) to view the list of events supported by that item. To create an event handler stub for an event, simply double-click the event name and Visual Studio 2008 automatically creates an event handler for you (see right side of Figure 2-29).
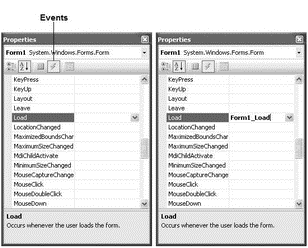
Figure 2-29
The Error List window (see Figure 2-30) is used to display:
□ Errors, warnings, and messages produced as you edit and compile code.
□ Syntax errors noted by IntelliSense.